Dodger Thoughts

Jon Weisman's outlet for dealing psychologically with the Los Angeles Dodgers, baseball and life

Category: Analysis (Page 2 of 2)

Baseball Prospectus playoff odds favor Dodgers

BP

By Jon Weisman

The Dodgers have the best odds of any team in baseball to win the World Series, according to the 2014 preseason Playoff Odds Report from Baseball Prospectus.

The analytical site gives Los Angeles a 83.6 percent chance of reaching the National League Division Series and 17.9 percent chance of winning the World Series. The latter figure is more than twice as high as any other NL team, with Detroit coming in as the American League favorite at 10.7 percent.

Baseball Prospectus’ simulation has the Dodgers winning 93 games. In the NL West, next behind the Dodgers are the San Francisco Giants, with 85 wins.

Read more about the Playoff Odds Report here.

Post-Arizona status report for the Dodgers

Colorado Rockies v Los Angeles Dodgers

By Jon Weisman

There’s definitely a weird feeling to this Spring Training interregnum between Arizona and Australia — not that it won’t feel even weirder next week, when the Dodgers follow their two regular season games Down Under with four off days and then a pair of Freeway Series exhibitions against the Angels.

Nevertheless, with no game action until the Dodgers scrimmage against Team Australia on Thursday, and the Dodgers having set their 30-man travel squad for Sydney, this does seem like an appropriate time to take a little bit of stock.

Read More

Is positional panic overblown?

Los Angeles Dodgers workout

By Jon Weisman

Many worry about potential uncertainty at second base for the Dodgers, and even team officials acknowledge that it’s a position that could be in flux in 2014.

It’s worth remembering, however, that one position won’t make or break the team.

Here’s a look at the offensive production the Dodgers received at every position (excluding pitcher) relative to the National League over the past 10 years, using the Baseball-Reference.com statistic sOPS+.

  • An sOPS+ of 100 indicates average production at the position.
  • Above 100 indicates above-average offense.
  • Below 100 indicates below average.

(Click each chart to enlarge.)

Positions chart - sOPS+

As you can see, even in playoff years, the Dodgers have had multiple positions with below-average production compared with the rest of the NL. In 2009, their best regular season in the past 10, the Dodgers had particularly disappointing offense from first base, where James Loney (.761 OPS) didn’t stack up against most of his peers.

In 2013, the Dodgers had a below-average sOPS+ at half their positions, and in 2004, they were underwater everywhere but second base (I bet you’ve forgotten how awesome Jose Hernandez was), third base and center field.

The numbers in the next chart indicate the Dodgers’ NL rank at a given position in a given year.

Positions chart - rank

In the Dodgers’ five playoff appearances over the past 10 seasons, their average rank in offense at a given position has been no worse than ninth in the NL. It helps to have across-the-board strength. Nevertheless, note that the Dodgers’ positional performance in 2008, when they won a weak NL West, was barely distinguishable from 2005, when they lost 91 games in an even weaker NL West.

It goes without saying that pitching and defense play enough of a role in a team’s fortunes that the offense at one position shouldn’t be a game changer, any more than greatness at one position will turn a losing team into a champion. (Hello, 2005 Jeff Kent.)

Obviously, the Dodgers want to be the best they can be at second base, whether it’s Dee Gordon, Alex Guerrero, Chone Figgins, Justin Turner or anybody else.  For that matter, there are other positions on the Dodgers that might not be offensive powerhouses. But you always need to keep the big picture in mind.

In any case, this is all on virtual paper anyway. Here’s one last chart — the primary starters for the Dodgers over the past 10 years, with the number of games each played at the position. More than a few times, you’d be hard-pressed to call anyone a regular. (Of course, we knew this already.)

Positions chart - players

The rarity of Dodger rookie regulars in April

Los Angeles Dodgers first full squad workout

By Jon Weisman

Just to show how unprecedented it would be for Alex Guerrero to step into the Dodger starting lineup at the beginning of the 2014 campaign, consider this:

In the eight previous seasons of the Ned Colletti era, no position player without previous MLB experience has been the Dodgers’ intended starter in March or April.

Since Colletti arrived, only three Dodgers have started more than 10 games before April 30 without previously playing in the Majors, and none was the first resort:

Blake DeWitt and James Loney in action at Game 1 of the 2008 National League Championship Series in Chicago. (Jon SooHoo/Los Angeles Dodgers 2008)

Blake DeWitt and James Loney in action at Game 1 of the 2008 National League Championship Series in Chicago. (Jon SooHoo/Los Angeles Dodgers)

James Loney, 2006: Loney made his debut on April 4 and started 10 games in a platoon with Olmedo Saenz while the Dodgers waited for Nomar Garciaparra to recover from a strained ribcage muscle suffered in the Freeway Series. Loney, who OPSed .595 in 44 plate appearances during this first taste of the Show, went to Triple-A once Garciaparra was activated April 22.

Blake DeWitt, 2008: DeWitt had but 45 games of experience above Single-A when he was thrust into the role of starter at third base, thanks to injuries not only to Garciaparra (wrist microfracture) but also Andy LaRoche (torn ulnar collateral ligament in right thumb) — both suffered in the same March 7 Spring Training game — as well as Tony Abreu. Nicknamed “The Solution,” DeWitt played regularly at third base with an OPS above .800 as he passed the 200-plate appearance mark in mid-June, before he slumped and was ultimately replaced by midseason acquisition Casey Blake. DeWitt remains the only Colletti-era Dodger to start the most games of anyone at his position in a given year (77) without having previously earned an MLB paycheck.

Jerry Sands, 2011: Sands slugged .529 for Double-A Chattanooga in 2010, but still began 2011 in the minors as predicted. He was called up April 18 to fill the roster spot of Xavier Paul, who was designated for assignment, and play some left field in a year the Dodgers began with Tony Gwynn Jr., Marcus Thames and Paul (with a sprinkle of Jamie Hoffmann). Sands played somewhat regularly into early June and ended up starting 53 games for Los Angeles in left field, right field and at first base.

Bringing up players in May has been a different story: Russell Martin, Andre Ethier and Matt Kemp are notable examples. But handing a position to a pure rookie before May Day just hasn’t been happening. Even Yasiel Puig, of course, waited until June last year.

While Guerrero isn’t a typical rookie, it would still be groundbreaking for him to serve as a regular for the Dodgers in March and April.

Can Dodgers improve batting with runners on in 2014?

Carl Crawford congratulates Adrian Gonzalez at home plate in a game at San Diego on April 11. (Jon SooHoo/LA Dodgers,LLC 2013)

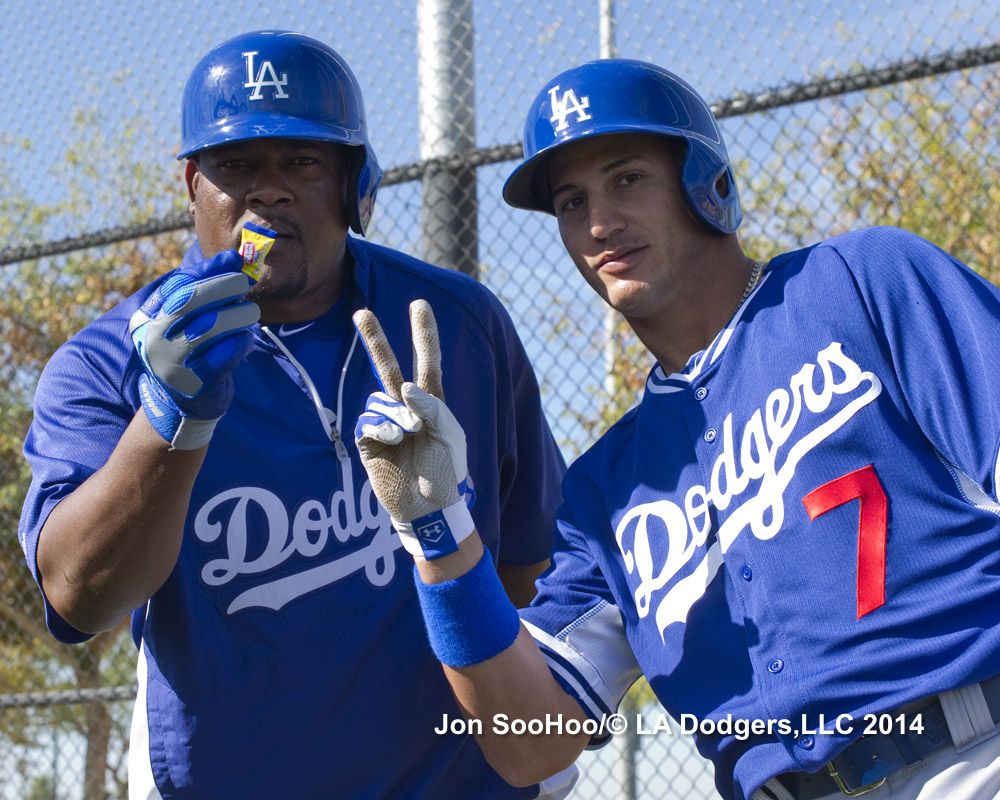
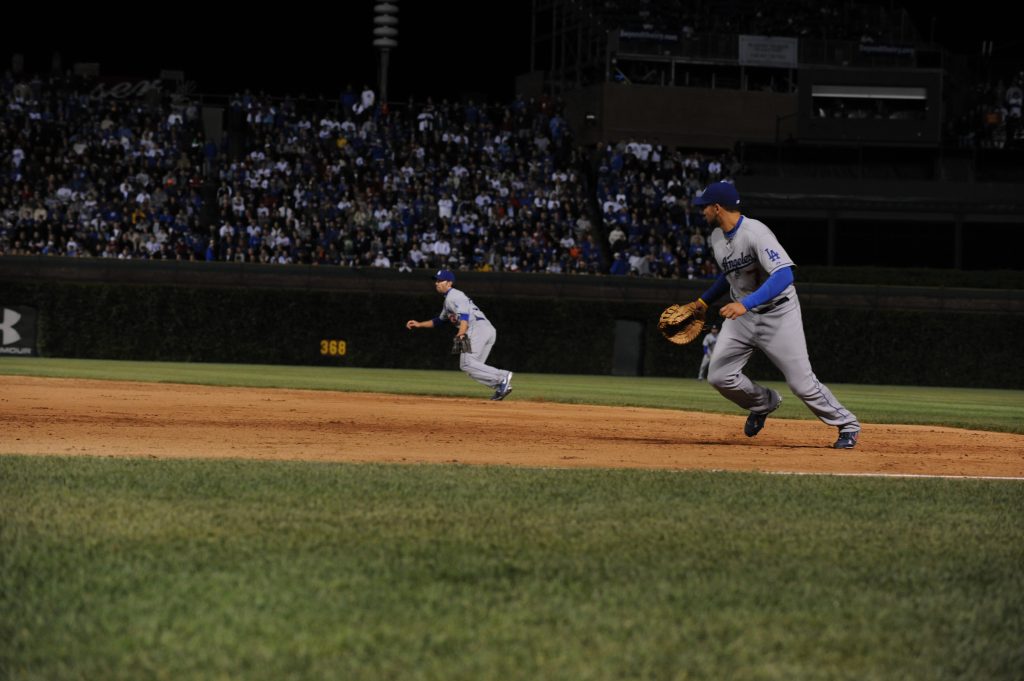
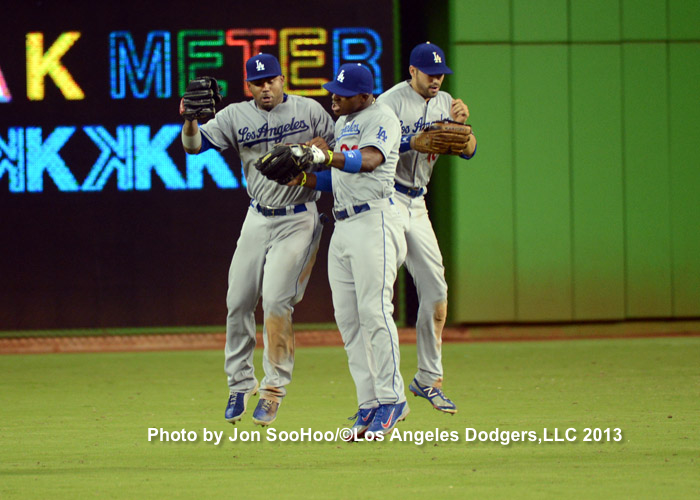
Carl Crawford congratulates Adrian Gonzalez at home plate in San Diego on April 11. (Jon SooHoo/LA Dodgers, LLC 2013)

By Jon Weisman

You don’t even need to look at the numbers, do you? The Dodgers, even as they went all the way to the National League Championship Series in 2013, didn’t hit enough with men on base, right?

Well, maybe we should look at the numbers anyway. Because they’re kind of interesting.

Dodgers with men on base, 2013
(ordered by plate appearances)

Rk PA ▾ HR BA OBP SLG OPS
1 Adrian Gonzalez 312 11 .308 .362 .491 .853
2 Andre Ethier 266 4 .243 .357 .356 .713
3 A.J. Ellis 232 5 .247 .320 .354 .674
4 Mark Ellis 209 4 .295 .340 .421 .761
5 Juan Uribe 195 6 .280 .328 .463 .791
6 Yasiel Puig 174 5 .259 .356 .395 .751
7 Carl Crawford 169 1 .272 .337 .338 .675
8 Skip Schumaker 165 2 .278 .354 .354 .708
9 Hanley Ramirez 149 10 .351 .416 .679 1.095
10 Matt Kemp 145 2 .246 .303 .346 .650
11 Nick Punto 134 0 .280 .320 .364 .685
12 Jerry Hairston 106 1 .217 .272 .283 .554
13 Tim Federowicz 86 2 .203 .286 .351 .637
14 Scott Van Slyke 76 1 .210 .329 .339 .668
15 Luis Cruz 67 1 .150 .200 .233 .433
Team Total 2805 55 .257 .325 .383 .708

Collectively, the Dodgers had a .325 on-base percentage with men on base, nearly identical to their overall 2013 OBP of .326. And of the nine players who came up the most in those situations, none had a lower OBP than .320.

Key RBI guys like Adrian Gonzalez (.362), Andre Ethier (.357) and, holy cow, Hanley Ramirez (.416) kept coming through time and again, either driving in runs or extending innings. Matt Kemp, by contrast, was disappointing at .303, but we’re going to talk more about him in a minute.

Where the Dodgers showed more of a dip was in their slugging percentage – .383 with runners on base, compared to .396 overall in the season. The difference was more pronounced with runners in scoring position.

Dodgers with RISP
(ordered by plate appearances)

Rk PA ▾ HR BA OBP SLG OPS
1 Adrian Gonzalez 188 7 .323 .378 .532 .909
2 Andre Ethier 156 2 .228 .372 .325 .697
3 A.J. Ellis 135 2 .255 .333 .345 .679
4 Mark Ellis 124 2 .282 .336 .388 .724
5 Skip Schumaker 110 2 .268 .336 .351 .687
6 Juan Uribe 105 2 .278 .340 .433 .773
7 Carl Crawford 103 1 .289 .359 .356 .715
8 Yasiel Puig 99 4 .234 .374 .416 .789
9 Matt Kemp 87 0 .230 .310 .270 .581
10 Hanley Ramirez 83 7 .368 .458 .779 1.237
11 Nick Punto 67 0 .246 .297 .351 .648
12 Jerry Hairston 63 0 .236 .274 .236 .511
13 Tim Federowicz 51 0 .122 .245 .171 .416
14 Scott Van Slyke 43 0 .229 .326 .314 .640
15 Luis Cruz 42 0 .128 .146 .154 .300
Team Total 1639 29 .252 .330 .367 .697

If the Dodgers were swinging for the fences with runners in scoring position, the stats show they weren’t connecting. Their slugging percentage dipped 7 percent compared with their overall 2013 performance. On the other hand, their OBP inched up, with the eight guys most frequently batting with RISP doing their part to drive in runs or at least extend innings. And again, Hanley – wow.

In general, given the sample sizes at play and the variables in terms of situation, I’m not sure how significant these differences are. You’d expect pitchers to be more vulnerable with runners on base, if only because vulnerable pitchers tend to put more runners on base. But pitchers being more careful with runners on could also play a role.

Which leads me to latest favorite stat: In 2013, Clayton Kershaw allowed five extra-base hits with runners in scoring position all year.

Keep all this in mind as I present the Dodgers’ performance with the bases loaded in 2013. The sample size shrinks … and the offense shrinks even more.

Dodgers with bases loaded, 2013
(ordered by plate appearances)

Rk PA ▾ HR BA OBP SLG OPS
1 A.J. Ellis 17 0 .143 .176 .214 .391
2 Mark Ellis 14 0 .417 .357 .417 .774
3 Juan Uribe 14 0 .154 .143 .385 .527
4 Skip Schumaker 14 0 .071 .071 .071 .143
5 Adrian Gonzalez 10 0 .375 .300 .500 .800
6 Carl Crawford 10 0 .333 .300 .444 .744
7 Andre Ethier 9 0 .143 .222 .286 .508
8 Matt Kemp 9 0 .125 .111 .125 .236
9 Tim Federowicz 8 0 .143 .125 .286 .411
10 Clayton Kershaw 8 0 .125 .125 .125 .250
11 Scott Van Slyke 8 0 .000 .125 .000 .125
12 Nick Punto 7 0 .200 .429 .200 .629
13 Yasiel Puig 6 1 .400 .500 1.000 1.500
14 Luis Cruz 5 0 .000 .000 .000 .000
15 Jerry Hairston 4 0 .500 .500 .500 1.000
Team Total 156 1 .190 .205 .270 .475

Those numbers … well, they are numbers. I’ll give them that. The Dodgers were last in the NL in batting with the bases loaded, by a wide margin. Coming in at 15th was Pittsburgh, with a .591 OPS.

How wildly inconsistent are they from hitter to hitter? No one on that list has a batting average between .200 and .300.

Also, do you see who isn’t on the list? Our friend Mr. Ramirez, whose total number of plate appearances with the bases loaded in 2013 was … one. (He got out.)

Once more, I’d offer that the quantity of plate appearances is too small to derive too much into the Dodgers’ bases-loaded performance, but we can say this: If you’re looking for a way the Dodgers can improve in 2014, look no farther.

I promised to circle back to Matt Kemp, and circle back we shall. Kemp, as you might have noticed, struggled in all of these situations, yet another reason his 2013 was so frustrating. But is it possible that we’ve got this backward – that his frustrations were the reason he struggled with men on base?

Look at how Kemp did in previous seasons:

Matt Kemp with men on base

I Year PA HR BA OBP SLG OPS
2006 85 4 .295 .318 .513 .830
2007 144 4 .373 .396 .560 .956
2008 296 6 .282 .342 .417 .760
2009 321 13 .279 .336 .463 .800
2010 324 15 .238 .299 .462 .761
2011 347 21 .344 .424 .626 1.049
2012 204 14 .331 .412 .651 1.063
2013 145 2 .246 .303 .346 .650
Career Total 1866 79 .295 .357 .505 .862

Matt Kemp with RISP

I Year PA HR BA OBP SLG OPS
2006 50 3 .273 .300 .523 .823
2007 85 2 .333 .353 .500 .853
2008 168 3 .268 .359 .394 .754
2009 190 9 .279 .342 .485 .827
2010 193 8 .225 .311 .456 .767
2011 200 13 .335 .450 .652 1.102
2012 107 5 .292 .383 .551 .934
2013 87 0 .230 .310 .270 .581
Career Total 1080 43 .279 .360 .486 .846

Matt Kemp with bases loaded

I Year PA HR BA OBP SLG OPS
2006 7 0 .167 .143 .167 .310
2007 10 0 .000 .100 .000 .100
2008 18 1 .250 .222 .500 .722
2009 19 3 .313 .316 .938 1.253
2010 15 1 .300 .333 .600 .933
2011 10 1 .571 .500 1.000 1.500
2012 9 0 .250 .222 .250 .472
2013 9 0 .125 .111 .125 .236
Career Total 97 6 .250 .258 .500 .758

Historically, Kemp has been good to great with runners on base, before falling off a cliff in 2013. (Weird stat No. 2: Kemp had more grand slams in 2009 than hits with the bases loaded in 2013). A healthier Kemp obviously makes the Dodgers a better team; this is but one example of the difference he might make.

The big question I have is how much control players really have over their performance with runners on base. In a conversation for the season preview story of the upcoming Dodgers’ March magazine (which you all are going to want to get), Dodger manager Don Mattingly shared his thoughts.

“You put an emphasis on it in Spring Training,” Mattingly said. “You continue to put guys in situations in camp and work on things. … Everyone tries to drive that run in, and a lot of times they do it really fast. Sometimes it’s just being willing to let the next guy do it, because they may not be willing to pitch to (you). So if they’re not going to give you anything to do it with … you’ve got to be willing to pass the baton and trust your teammate.”

Easier said than done? No doubt. But even though their performance with runners on base might be better than you realized — and certainly improved when they heated up in the summer — it remains something the Dodgers will think about.

Crawford, Ethier, Kemp and Puig: Quadrangles in the outfield

DODGERS AT MARLINSBy Jon Weisman

I worry. A lot. Which makes me a pretty good barometer for not worrying. If it doesn’t bother me, it probably shouldn’t bother you.

This fear that the Dodgers have one too many starting outfielders, I’ve pretty much dismissed. Not just that there are worse problems to have, but that this isn’t even a problem.

Whether it’s the timing of Matt Kemp’s return to regular action, fear that Yasiel Puig will run into one wall too many or general concern over the vulnerability of Carl Crawford and Andre Ethier, the chances that the Dodgers will have four healthy outfielders for the entire year seem about as likely as the 2013-14 Lakers will string together four wins in a row the entire season. (Yeah, I went there.)

Worrying about a surplus is so Spring 2013. There was the Dodgers’ so-called overload of starting pitchers, and we know how that turned out.

But since no one’s rooting for bad health or bad karma, and it is possible that Kemp and Co. hit April at full strength — even if Kemp were to sit out the Dodgers’ Australia games — how uncomfortable could it be?

Let’s start by defining some kind of ideal. In 2011, the year of his near-Most Valuable Player campaign, Kemp played 1,380 innings in the outfield and had 689 plate appearances. Let’s call those the benchmarks of happiness – or to make them easier to remember, the Benchmarks of Happiness.

LOS ANGELES DODGERS AT ATLANTA BRAVESMeanwhile, the Dodgers can expect to have no more than 4,400 innings to pass around the outfield this year (162 games x three outfielders x nine innings = 4,374). That number’s on the high side, even allowing for extra innings, if you factor in that some games will require only eight outfield innings unless the Dodgers go undefeated on the road. Plus, there will be 10 games in American League parks in which a healthy starting outfielder might be the designated hitter.

That means that if all four outfielders were completely healthy and Don Mattingly divided their time equally, they could each get 1,100 innings, or 80 percent of the Benchmark of Happiness. Not bad, especially considering how good their bodies would feel under this scenario.

Of course, this isn’t the scenario that worried people. That was the scenario where there were four healthy outfielders but one got the short straw, the straw that, to paraphrase Reggie Jackson, doesn’t stir the drink, unless that drink is in a shot glass.

If three teammates each took 1,300 innings in the outfield and left you with only 500, that’s a pretty big difference, especially if you consider yourself All-Star caliber, as Kemp, Ethier and Crawford have been and Puig is poised to be.

Lazy as I can be, I wouldn’t want to be the 500-inning guy, not if I felt I could do more.

Nevertheless, to that, I say the following:

  • You probably don’t become the 500-inning guy unless you’re having a rough season at the plate. It’s simply not in Mattingly’s nature to marginalize a productive player.
  • If three outfielders are so good that they render the fourth irrelevant, well, at least you’ve got three great outfielders.
  • Even coming off the bench, you can be a difference-maker. 
  • None of the four outfielders has a contract on the line this season – or for quite some time. Crawford’s deal runs through 2017, Either’s through 2017 with a club option for 2018, Puig’s through 2018 and Kemp’s through 2019. Puig reportedly has a clause in his contract that allows him to opt into arbitration after three years of service time, but that’s not an immediate worry. Each is already earning more money than they could have dreamed of. This is a good time to be selfless.
  • It’s one thing to not be happy that you’re not playing every day, but to actually cause the team trouble because you’re not playing every day, knowing that a World Series is at stake and knowing that at any moment, you could be called upon to play more … I just can’t even finish the thought. It’s too extreme. It’s also why you have a Don Mattingly as your manager – to deal with that.

The bottom line is this: Would it be worth it for the Dodgers to weaken their outfield depth, in the face of potential injuries, just to ward off this potential of pouting so powerful that it would derail the team? I don’t see it.

When Spring Training arrives next month, we’ll no doubt see a round of stories addressing the four-outfielder dilemma, and the Dodgers’ position, I suspect, will be as it’s been this offseason – that there is no dilemma. And they’ll be right. True, one of these guys will be on the bench for the first pitch of the season. What happens next is anyone’s guess, which is why it’s not worth worrying about.

Kershaw’s contract reflects that pitching is a full-time job

LOS ANGELES DODGERS AT ARIZONA DIAMONDBACKSBy Jon Weisman

One of the counterpoints to the general “Hail contract, well met” about Clayton Kershaw’s extension last week was that it’s too much money to give to someone who only pitches once every five games.

However, “once every five games” understates Kershaw’s impact on the season. Pitchers have far more interactions in a game than any other position on the field, and Kershaw, being who he is, has almost as many as anyone.

In 2013, for example, Kershaw faced 908 batters, or 182 more than the Major League leader in plate appearances, Joey Votto. Factor in that 689 of the batters Kershaw faced made outs (plus another 31 retired on the bases thanks to double-play grounders, caught stealing and pickoffs), and you can begin to see how tremendous his impact was.

Certainly, those guys didn’t make outs by themselves – outside of his 232 strikeouts, the remainder were put into play and almost entirely handled by fielders other than Kershaw, who had 27 assists in 2013. And many position players make a difference in the field as well as at the plate. But my point is, we should be far past the point of viewing starting pitchers as part-timers. (Not incidentally, this explains why they shouldn’t be counted out of the most valuable player voting.)

No one risks facing high-stress situations in baseball more often than starting pitchers. Kershaw, by avoiding them for the most part and embracing them so adroitly when they do arrive, deserves acknowledgment for that.

As for the money itself … few are under any illusions that the relative salaries of firefighters and firearmers are in moral proportion. But within a baseball context, looking at his past performance and his future projections, Kershaw’s contract passes muster (as Dave Cameron notes at Fangraphs) in this era, even with physical risk factored in. That’s the world we live in … and Clayton Kershaw, as much as anyone, deserves his rewards.

Page 2 of 2

Powered by WordPress & Theme by Anders Norén